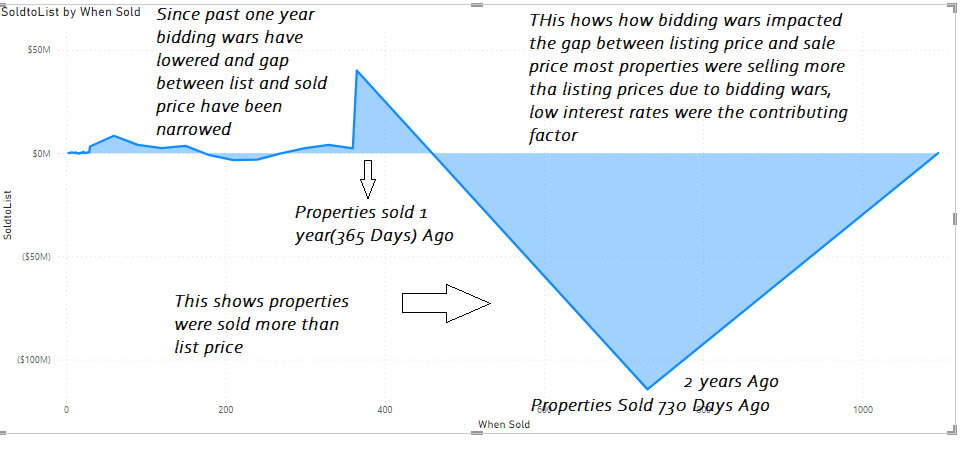
The gap between the listing price and sale price has significantly narrowed, as depicted in the graph. This graph illustrates a comparison of the price versus the listing gap over the past two years. Two years ago, bidding wars were common, resulting in a larger disparity between the listing price and the sale price. However, in the last year, this gap has notably decreased, primarily due to an increase in interest rates.
The graph provides a visual representation of the sold listings in Mississauga over the last two years, highlighting the trend of diminishing differences between listing prices and actual sale prices. This shift is indicative of the impact of changing market conditions, particularly the influence of increased interest rates on buyer behavior and negotiation dynamics.


Leave a Reply